Quick overview for busy humans
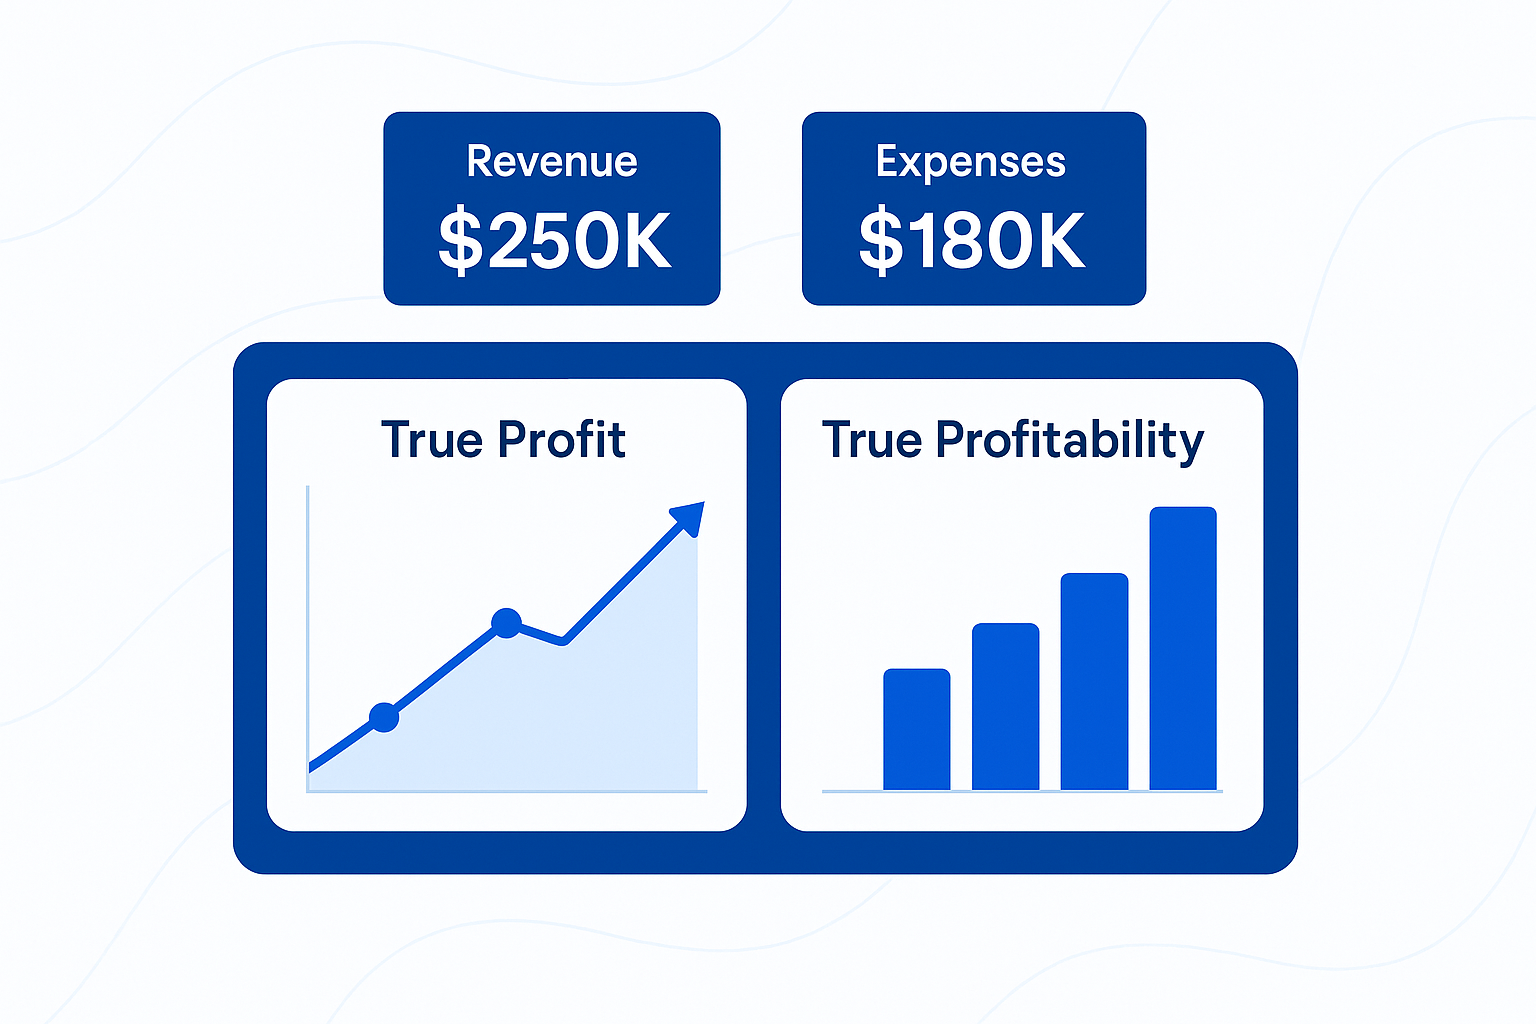
True Profit is what’s left over for owners after paying all operating costs, market‑rate owner pay, taxes, debt service, and necessary reinvestment (CapEx + working capital). True Profitability is the repeatable margin you can expect each month/quarter after normalizing for seasonality and one‑offs.
Bank balance ≠ profit. CleverProfits installs a simple operating model (forecast, normalized P&L, cash map) so you know: (1) what your real margin is, (2) how much you can safely distribute, and (3) how to raise margins next quarter.
Why “bank balance profit” is a trap
Your bank account shows cash at a point in time, not your economics. Cash spikes after a big deposit or tax refund; it sinks after payroll, inventory purchases, or quarterly estimates. If you’re judging profit by your bank app, you’re flying by weather, not instruments. True profitability requires accrual‑based visibility, normalization (owner comp, one‑offs), and a clear view of future cash obligations (debt, taxes, CapEx).
Mantra: Profit is a habit in your operations, not a moment in your bank account.
Definitions that matter (plain English)
- Gross Margin (GM): Revenue minus direct costs to deliver (COGS or Cost of Service). Tells you if your pricing/workflow works.
- Contribution Margin (CM): GM minus delivery labor (and media spend for agencies). Shows per‑unit profitability before overhead.
- Operating Margin (OM): CM minus overhead (G&A, rent, tools, leadership, marketing).
- Owner‑Normalized Profit: OM after replacing below‑market founder pay with a market‑rate salary.
- True Profit (TP): Owner‑normalized profit minus: required debt service (principal + interest), tax provision, and required reinvestment (CapEx + working capital needed for growth).
- True Profitability: Your sustainable margin after removing one‑offs and smoothing seasonality—what you can plan on for the next 12 months.
- Working Capital (WC): Cash tied up in AR + inventory − AP. Growth eats cash here first.
The True Profit Formula
Start with accrual P&L → normalize → subtract unavoidable cash claims → sanity‑check with cash.
- Operating Profit must reflect a market‑rate founder salary (even if you currently take distributions).
- Tax Provision uses your effective tax rate given entity type and state footprint.
- Required Reinvestment covers assets you must buy and the incremental WC for growth next quarter.
Rule of thumb: If TP is negative while Operating Profit is positive, you’re likely under‑pricing, over‑hiring ahead of demand, or growing faster than your cash engine can fund.
The True Profitability Flywheel
- Measure: Clean books, accrual basis, normalized owner pay.
- Model: 12–18‑month forecast with scenarios; pricing & staffing rules.
- Manage: Monthly KPI cadence, variance review, and actions.
- Multiply: Reinvest only from surplus TP into the next most profitable channel.
This turns profit from a surprise into a system.
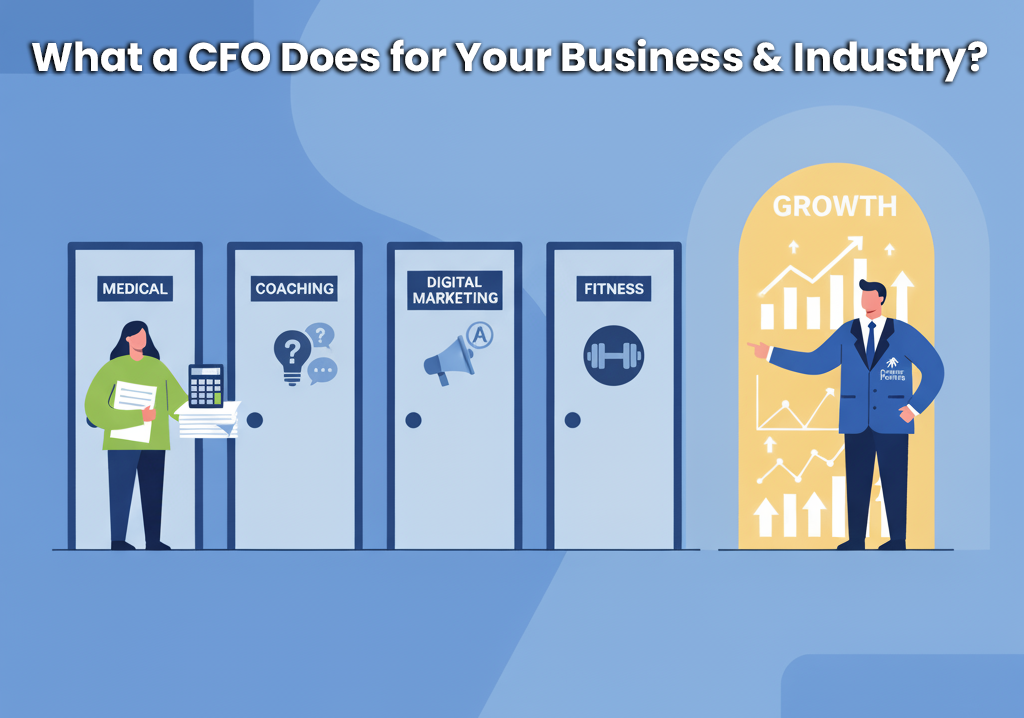
Margins by model: med spas, agencies, coaches
(These are directional ranges we see across healthy operators; individual results vary by market, pricing power, and sophistication.)
Med Spas (aesthetics clinics)
- Revenue drivers: injectables, laser, facials, packages/memberships, retail.
- Direct costs: consumables, provider labor (NP/PA/RN), device maintenance, room time.
- Healthy targets:
- Gross Margin: 55–70% (varies by treatment mix; injectables lower GM than facials but higher CM with efficient providers).
- Contribution Margin after provider labor: 35–50%.
- Operating Margin (after overhead & market owner pay): 12–25%.
- Levers to improve TP:
- Memberships with utilization guardrails (minimum pricing per room hour).
- Inventory discipline on toxins/fillers; reduce waste & expiries.
- Schedule density (provider utilization ≥75%).
- Prepaid packages (positive WC) and deposit policies to cut no‑shows.
- Finance expensive devices through predictable cash flows; model ROI per machine before purchase.
Digital Marketing Agencies
- Revenue drivers: retainers, performance fees, media management, creative, strategy.
- Direct costs: delivery labor (AMs, media buyers, creatives), freelance, media pass‑through.
- Healthy targets:
- Gross Margin (after media pass‑through): 45–60%.
- Contribution Margin (after delivery labor): 25–40%.
- Operating Margin (after overhead & market owner pay): 10–20%.
- Levers to improve TP:
- Role clarity and utilization (billable ≥75%, blended rate ≥2.5× loaded cost).
- Pricing architecture (tiered retainers, change‑order discipline, minimum fees).
- Client concentration <20% per account; proactive churn modeling.
- Short DSO (auto‑pay, deposits, milestone billing).
- Productized add‑ons with high CM (audits, CRO sprints, strategy days).
Coaches / Education Businesses
- Revenue drivers: cohorts, 1:1 programs, digital courses, events, community.
- Direct costs: delivery time for coaches, fulfillment platforms, contractors, event costs.
- Healthy targets:
- Gross Margin: 70–85% (digital delivery), lower if live event heavy.
- Contribution Margin (after delivery labor): 45–65%.
- Operating Margin (after overhead & market owner pay): 15–30%.
- Levers to improve TP:
- Cohort capacity planning (seat caps, price‑to‑value, attendance SLAs).
- CAC:LTV governance; cap ad spend by payback period (≤3 months for cash‑tight operators).
- Downsell library (workshops, templates) for better funnel yield.
- Subscription/continuity layer for durable MRR.
Cross‑industry Benchmarks (broad strokes)
- Healthy Operating Margin: 10–25% (service‑heavy toward low end; digital toward high).
- Cash Conversion Cycle: −10 to +30 days (aim negative via deposits/subscriptions).
- Owner Distributions (safe harbor): typically ≤ 50% of last quarter’s TP unless runway >4 months.
Case studies (anonymized): before → after
Med Spa (multi‑provider)
- Before: $3.6M revenue, GM 58%, OM 6%, negative TP due to device financing + tax under‑provision.
- After (2 quarters): GM 63%, OM 16%, TP positive; added memberships, tightened scheduling, proper tax set‑aside, deferred a device purchase until utilization justified it.
Digital Agency (retainer + performance)
- Before: $5.2M, CM 22% (bloated delivery), OM 5%, cash tight from long DSO.
- After (3 quarters): CM 33%, OM 14%; implemented utilization targets, productized strategy, auto‑pay with retainers, and client cap rules.
Coaching Business (cohort + evergreen)
- Before: $2.1M, GM 78%, OM 9%; TP thin due to ad‑led launches and refund spikes.
- After (2 quarters): OM 18%, TP materially positive; capped CAC by payback, added continuity membership, improved refund policy.
Common pitfalls that distort “profit”
- Cash‑basis illusion: Deposits inflate “profit” now; future delivery costs haven’t hit yet.
- Founder pay missing: Taking draws but not expensing a market salary overstates profit.
- Misclassified costs: Delivery labor in overhead hides weak unit economics.
- Media spend treated as “fixed”: It’s variable with revenue and must be governed by payback rules.
- Under‑provisioned taxes: No quarterly set‑asides → surprise tax bills that crush cash.
- Device/CapEx creep (med spas): Buying machines without throughput to support payments.
- Scope creep (agencies & coaches): Over‑delivery without price correction.
- Slow collections: High AR turns paper profit into cash stress.
- No working capital plan: Growth consumes cash before it shows as profit.
CleverProfits method: How our CFOs lay it out simply
What we install in Month 1–2
- Normalized P&L with owner market pay and clean cost buckets (COGS vs delivery labor vs overhead).
- Unit Economics Model by service/treatment/program, with price floors and discount guardrails.
- 13‑Week Cash Flow + tax provision calendar and debt service map.
- Operating Model (18–24 months) with scenarios and hiring triggers tied to utilization.
- KPI Tree: 5–7 needles (GM, CM, OM, DSO, Utilization, Payback, Retention).
- Distribution Policy: a rules‑based framework for how much owners can safely take.
How the meetings work
- Monthly close in <10 business days.
- Exec Finance Review: variance → actions → owners → due dates.
- Quarterly Reset: pricing tests, channel caps, headcount plan.
Outcome: a monthly report with “Owner’s Earnings” view that shows exactly what can be distributed without starving growth or taxes.
What improves within 1–3 quarters
- Operating Margin: +3–10 points via pricing, staffing, and leakage fixes.
- Cash Runway: +1–3 months from WC discipline and tax provisions.
- Forecast Accuracy: <10% variance by Q3.
- Collections: DSO cut by 10–20 days with structured invoicing/auto‑pay.
- Decision Velocity: faster yes/no on hires, devices, campaigns.
Templates & checklists
Owner’s Earnings / True Profit Worksheet
- Operating Profit (after market owner salary)
- − Debt service (P+I)
- − Tax provision (federal/state/SE)
- − CapEx (required)
- − Working capital required for next 90 days
= True Profit (distributable/surplus)
Pricing & Utilization Guardrails
- Minimum price per room hour (med spa)
- Minimum gross margin per package (coaches)
- Utilization ≥75% for delivery roles (agencies)
- Payback period thresholds for ads (≤3 months cash payback unless runway ≥6 months)
Distribution Policy (example)
- If runway ≥4 months and last‑quarter TP positive: distribute up to 50% of TP.
- If runway <2 months: no distributions; build cash until threshold met.
- If debt covenants apply: prioritize covenant headroom before distributions.
FAQ’s
Is “true profit” the same as EBITDA?
Not quite. EBITDA ignores debt principal, taxes, and working capital needs. True Profit deducts those cash claims, so it’s closer to “Owner’s Earnings.”
We’re growing fast but cash is tight—broken model?
Maybe not. Growth consumes working capital first. Fix AR terms, require deposits, or pace growth to cash.
Do I need accrual accounting to do this?
Yes. Cash‑basis hides timing mismatches; you can’t see unit economics clearly without accrual.
How often should we update the model?
Monthly close + quarterly plan reset is the cadence that sticks.
What’s a good tax provision rule of thumb?
Depends on entity/state, but many owner‑operated companies provision 20–35% of pre‑tax operating profit pending bespoke tax planning.
Ready for clarity? Book a CFO consult
If your bank balance goes up and down but your confidence doesn’t follow, you need an Owner’s Earnings view today. CleverProfits installs the modeling, reporting, and tax planning that turns guesswork into a rules‑based profit system.
👉 Book a call with a CleverProfits CFO to calculate your True Profit and design your next‑quarter margin moves before the next payroll hits.

The Clever Writing Team
The CleverProfits writing team includes various team members in Advisory, Financial Strategy, Tax, and Leadership. Our goal is to provide relevant and easy-to-understand financial content to help founders and business leaders reach their true potential.
TABLE OF CONTENTS
- 13‑week cash flow, agency margins, CAC:LTV, CapEx, cash conversion cycle, coaching business profit, contribution margin, debt service, how to calculate profit, market‑rate owner salary, med spa profitability, operating margin, owner’s earnings, tax provision, true profit, true profitability, utilization, working capital